
How to Debug Software Code Effectively: Step-by-Step Guide
Struggling with broken code? Master how to debug software code like a professional developer. This guide covers systematic approaches, essential debugging tools, best practices, and advanced techniques to help you build reliable software.
Debugging is a critical skill in modern software development. Learning how to debug software code helps developers quickly identify, isolate, and fix issues affecting performance and functionality. This guide covers practical methods like reading error messages, using breakpoints, analyzing logs, and systematic testing. Whether beginner or experienced, structured debugging improves code quality, reduces development time, avoids common mistakes, and helps you write cleaner code while building more reliable applications across different environments.
What is debugging and why it matters
Debugging is the process of finding, analyzing, and fixing errors or unexpected behavior in software code. It ensures that applications run correctly and deliver intended results. Debugging matters because even small bugs can cause crashes, security issues, or poor performance in real-world systems. It helps developers understand how their code behaves during execution and improves problem-solving skills. By debugging, developers can identify root causes instead of guessing fixes. This leads to more stable and efficient software. In professional development, debugging also reduces maintenance cost and improves user experience by ensuring reliable, high-quality applications across different environments and platforms consistently deployed.

Common types of software bugs
Software bugs can appear in many forms. The most common include:
- Syntax errors: Mistakes in code structure or grammar
- Runtime errors: Issues that occur while the program is running
- Logical errors: Code runs but produces incorrect results
- Performance bugs: Slow or inefficient application behavior
- Integration errors: Problems when connecting multiple systems or APIs
Recognizing these early is key to learning how to debug software code efficiently.
How to debug code effectively: A structured approach to debugging code
The best developers follow a repeatable process when bugs appear. Here is a four-step framework that works across languages and environments.
Step 1: Gather information
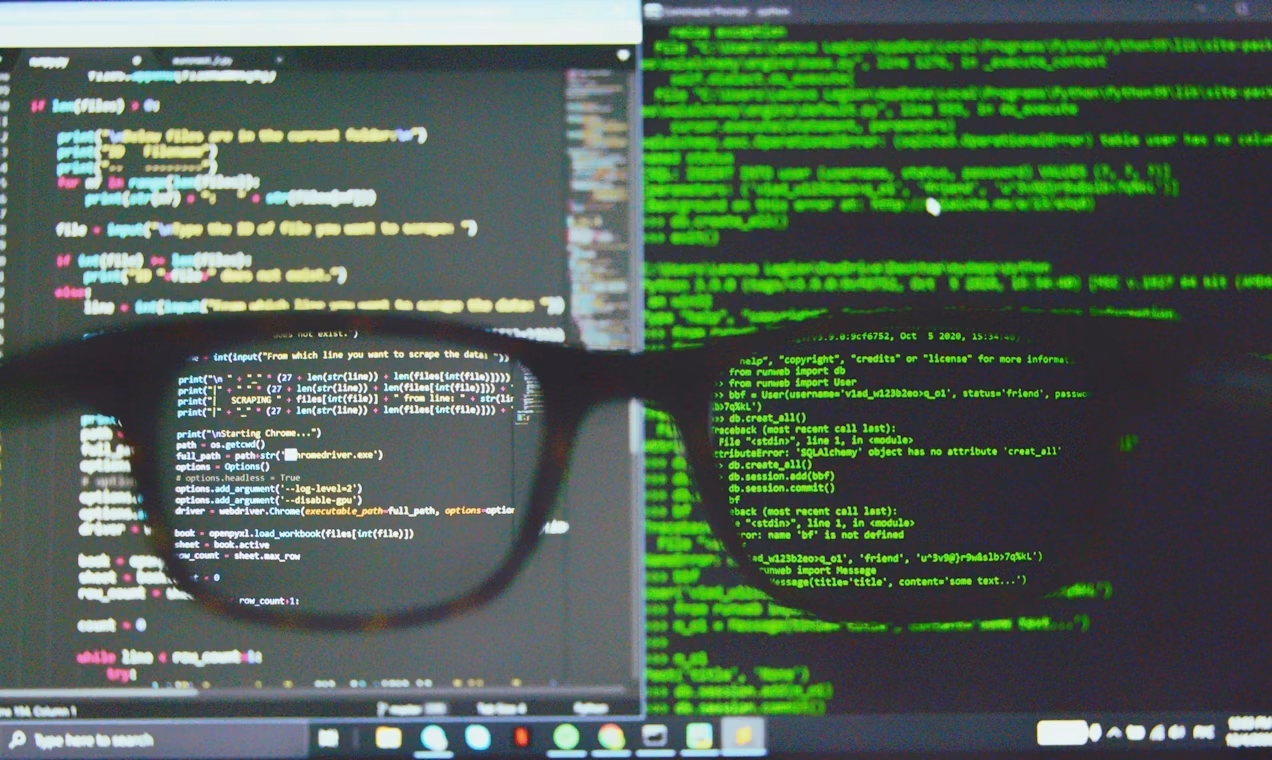
Start by collecting everything you know. Check your log files. Ask what the user was doing when the issue occurred. Look for error messages or exceptions. Determine whether you can reproduce the problem reliably, because a reproducible bug is a bug that can be fixed.
Step 2: Form a hypothesis
Based on what you know, form an educated guess about where the bug might be and why. Be specific. "I think the stock price is returning zero because of a typo in the config file" is a useful hypothesis. "Something is broken somewhere" is not. Trust your instincts when something looks unusual - anomalies are usually worth following.
Step 3: Test the hypothesis
Try to recreate the issue under controlled conditions. Use your debugger, add targeted log statements, or build a small isolated proof-of-concept that strips away unrelated code. If your hypothesis turns out to be wrong, go back to step two with the new information you have gathered. Iteration is normal - even experienced developers rarely nail the root cause on the first attempt.
Step 4: Plan the fix
Once you have confirmed the root cause, think carefully before touching the code. Ask whether your fix addresses the symptom or the underlying cause. Good fixes often include both a direct correction and a defensive measure, such as input validation or a more descriptive error message, so the same failure cannot silently reoccur down the line.
Essential debugging tools every developer should know
Having the right tools in your toolkit is just as important as having the right process. Modern IDEs and editors come with powerful debugging capabilities built in.
Debugging in Visual Studio Code
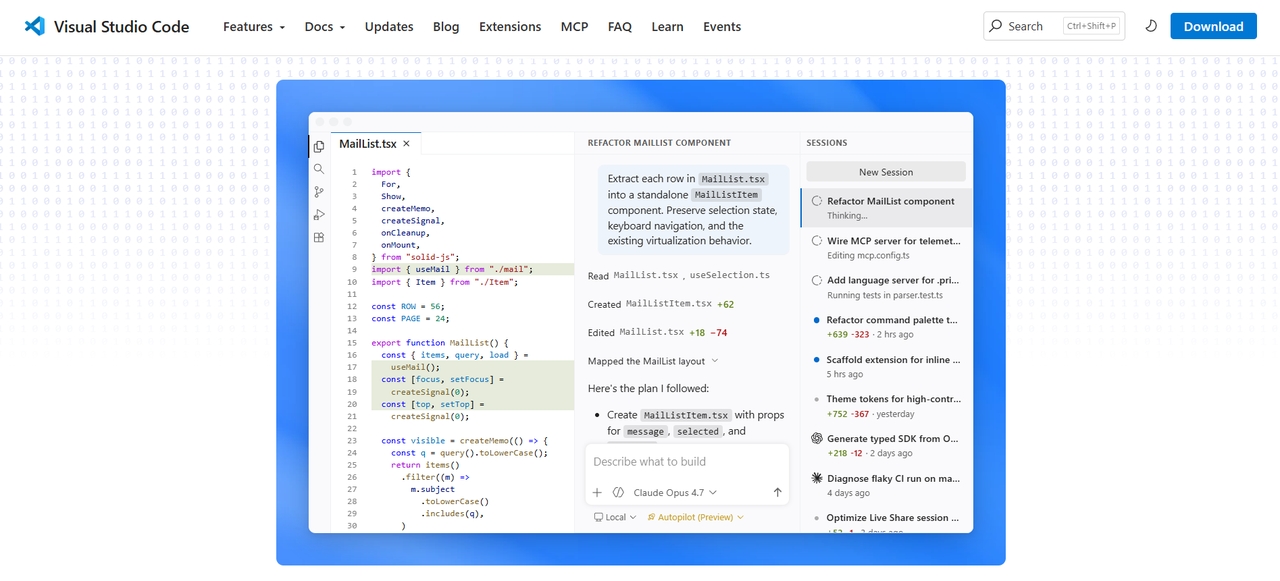
VS Code includes built-in debugging support for JavaScript, TypeScript, and Node.js, with extensions available for virtually every other language through the Visual Studio Marketplace. The debugger interface in VS Code has five core components:
- Run and Debug view: Shows all session information, configurations, and controls.
- Debug toolbar: Buttons for continue, step over, step into, step out, restart, and stop.
- Debug console: An interactive REPL where you can evaluate expressions and inspect output in real time.
- Debug sidebar: Displays the call stack, breakpoints, variables, and watch expressions.
- Run menu: Quick access to the most common debug commands.
To start debugging in VS Code, press F5 or select Run and Debug from the sidebar. For simple applications, VS Code will attempt to run the active file. For more complex scenarios, you will need a launch.json configuration file. VS Code's Copilot integration can even generate this file for you automatically.
Debugging in Visual Studio
Microsoft Visual Studio offers a deeply integrated debugging experience. You enter debugging mode using F5, at which point Visual Studio monitors everything happening as your program runs. When an exception occurs, the Exception Helper jumps you directly to the problematic line and offers contextual information to guide your fix.
Visual Studio also supports step commands that give you granular control over code execution. F10 (Step Over) executes the next line as a single unit without drilling into method internals. F11 (Step Into) follows execution into the next method call, letting you trace exactly what happens inside. Together, these let you walk through logic one statement at a time, which is the fastest way to find where a variable takes an unexpected value.
Browser Developer tools
For web developers, browser DevTools - built into Chrome, Firefox, Edge, and Safari - offer a full debugging environment without installing anything extra. The Sources panel lets you set breakpoints directly in JavaScript running in the browser, step through execution, and inspect variables just as you would in a desktop IDE. The Console panel doubles as a live REPL for evaluating expressions and logging output. The Network panel reveals failed requests, slow responses, and unexpected payloads that often sit at the root of front-end bugs.
Logging and observability tools
Not every bug is reproducible locally, and not every environment supports an attached debugger. In those cases, structured logging becomes your primary window into system behavior. Tools like Datadog, Splunk, and the ELK stack let you search, filter, and visualize log output across distributed systems. Cloud-native options such as AWS CloudWatch, Google Cloud Logging, and Azure Monitor provide real-time log streaming alongside metrics and alerts.
While standalone debugging tools are essential for inspecting code, modern development workflows increasingly benefit from integrated AI platforms that reduce context switching. For teams building full-stack applications, solutions like Enter Pro combine code generation, live preview, debugging assistance, and deployment in a single environment, helping developers identify and resolve issues more efficiently across the entire development lifecycle.
How to use breakpoints effectively
Breakpoints are the most fundamental feature of any debugger. A breakpoint pauses execution at a specific line, letting you examine the program state before problematic behavior occurs. In both VS Code and Visual Studio, you set a breakpoint by clicking in the left gutter next to a line number, or pressing F9 with your cursor on that line.
Modern debuggers support several types of breakpoints beyond simple line pauses:
- Conditional breakpoints: Pause only when a specific expression evaluates to true, which is invaluable when a bug only manifests for certain input values.
- Hit-count breakpoints: Pause after a breakpoint has been reached a certain number of times, useful in loops.
- Triggered breakpoints: Activate only after another specified breakpoint fires, helping diagnose bugs that only appear under certain preconditions.
- Logpoints: Print a message to the debug console without pausing execution, which avoids cluttering your source code with temporary print statements.
When you hit a breakpoint, inspect the Variables panel to see the current state of all in-scope values. Use Watch expressions to monitor specific variables across multiple frames. The Call Stack panel shows you exactly how execution arrived at this point - an essential tool for understanding context in deep or recursive code paths.
Practical debugging tips to find bugs faster
Quick debugging requires smart techniques that help developers identify issues faster, reduce complexity, and fix bugs with greater accuracy and efficiency.
- Reproduce the bug consistently
The first step in effective debugging is reliably reproducing the issue. Try to identify exact steps that trigger the bug. Once you can consistently reproduce it, you gain better control over testing fixes and understanding what conditions cause the problem in your software.
- Read error messages carefully
Error messages often contain direct clues about the root cause. Instead of ignoring them, analyze stack traces, file names, and line numbers. These details help narrow down the issue quickly and prevent unnecessary guesswork while debugging complex applications or unexpected failures.
- Use breakpoints strategically
Breakpoints allow you to pause code execution at specific points. This helps inspect variable values and program flow step by step. By using breakpoints strategically, you can quickly locate where the logic breaks and understand how data changes during execution.
- Isolate the problem area
Instead of reviewing the entire codebase, narrow down the section where the bug occurs. Comment out sections or test modules individually. Isolating the issue reduces complexity and helps you focus only on the code responsible for unexpected behavior.
- Test small changes one at a time
When fixing bugs, avoid making multiple changes at once. Apply one fix and test it before moving forward. This approach ensures you clearly understand what solved the issue and prevents introducing new bugs while attempting to fix existing ones.
Meet Enter Pro: Accelerate your development workflow
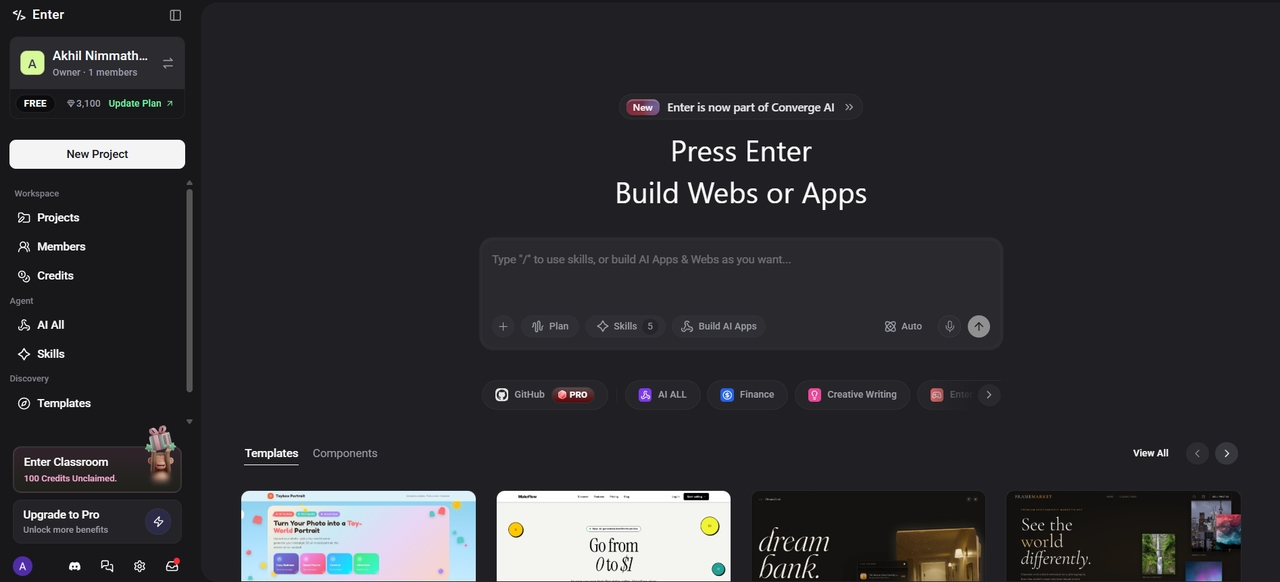
Enter Pro simplifies full-stack development with AI-generated code, real-time preview, and integrated deployment, so developers can spot and iterate on issues faster. Because Enter Pro generates and manages the full stack, including React frontend, Supabase backend, serverless functions, and edge deployment, it maintains complete context across the system. This unified understanding helps developers debug faster, reduce complexity, and build reliable applications with significantly improved workflow efficiency.
Key features of Enter Pro
- Full-stack AI debugging: Enter Pro analyzes the entire application stack, including frontend, backend, APIs, and deployments, to detect and fix issues at their root instead of isolated files.
- Autonomous code fixing: The platform can automatically suggest and apply fixes to generated code, reducing manual debugging effort and speeding up development cycles.
- AI-assisted planning & reasoning: Using Plan Mode, the AI breaks down debugging problems into clear, logical steps. It shows its reasoning process transparently, allowing you to follow along, validate logic, and debug more effectively with confidence.
- Visual editor with real-time preview: Using visual editor, make instant visual changes and see live updates in the built-in preview. This feature dramatically reduces time spent debugging UI, layout, and front-end issues by letting you fix problems directly in the editor.
Start building and iterating faster—sign up for free.
Common debugging mistakes to avoid
Many debugging issues come from simple mistakes that slow progress, waste time, and make fixing code more complicated unnecessarily.
- Ignoring error messages: Many developers overlook error messages and stack traces, assuming they are confusing or unhelpful. In reality, these messages often point directly to the root cause. Ignoring them leads to wasted time and unnecessary guesswork during the debugging process.
- Changing multiple things at once: When trying to fix a bug, changing several parts of the code simultaneously makes it hard to identify what actually solved the issue. This can also introduce new bugs. Always modify one thing at a time and test carefully.
- Not reproducing the issue consistently: If you cannot reliably reproduce a bug, it becomes extremely difficult to fix it. Skipping this step leads to incomplete understanding of the problem and temporary fixes that may fail in real-world usage or edge cases.
- Overlooking simple causes: Developers often assume complex reasons for bugs while ignoring simple mistakes like typos, incorrect variables, or misconfigured settings. Checking basic issues first can save significant time and effort during debugging.
- Skipping proper logging: Without proper logs, it becomes hard to trace how data flows through the system. Missing logs reduce visibility into application behavior, making debugging slower and more dependent on trial and error.
Conclusion
Debugging is an essential skill for every developer, helping transform broken code into reliable, efficient software. By understanding common bugs, using the right tools, and following a structured debugging process, you can quickly identify and fix issues. Practical tips like reproducing errors, reading messages carefully, and isolating problems make debugging faster and more accurate. Avoiding common mistakes further improves efficiency. With modern platforms like Enter Pro, debugging becomes even faster through AI-driven analysis, full-stack awareness, and automated verification for smoother development workflows.
FAQs
How do I start debugging code as a beginner?
Begin by reading error messages carefully, reproducing the issue, and using print statements to track variable values. Set breakpoints in your IDE and step through the code line by line. Stay patient and systematic while learning how to debug software code effectively.
What are common debugging techniques?
Common debugging techniques include using breakpoints, logging, code inspection, unit testing, and step-through debugging. Developers also isolate modules, review stack traces, and test assumptions to identify where the code behavior deviates from expected outcomes.
What is rubber duck debugging?
Rubber duck debugging involves explaining your code and problem aloud to an inanimate object or colleague. This forces clearer thinking and often helps reveal the bug. It is a simple yet powerful technique for improving problem-solving and identifying issues in software more effectively.
How long does it take to debug code?
The time required to debug code depends on complexity, bug type, and codebase size. Simple issues may take minutes, while complex system-level bugs can take hours or days. Good practices and tools significantly reduce debugging time.
What is the difference between debugging and testing?
Testing identifies whether software works as expected, while debugging finds and fixes the root cause of failures. Testing reveals issues, but debugging investigates and resolves them to ensure the application behaves correctly under all conditions.